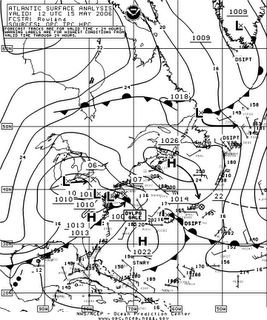
Surface Chart depicting the onshore (SE) flow between a complex low centered over the Great Lakes, and a blocking ridge of high pressure centered south of Nova Scotia. This synoptic setup caused three days of continues heavy rain over parts of Southern New England, causing the worst flooding in many places since 1936.


0 Comments:
Post a Comment
<< Home